BI Solutions - Pegasus

Constellation Healthcare Technologies recognizes the importance of activities beyond billing and collections when it comes to the success of a practice. We integrate and deliver all necessary practice information on a single, consolidated platform called Pegasus.
Meet Pegasus:
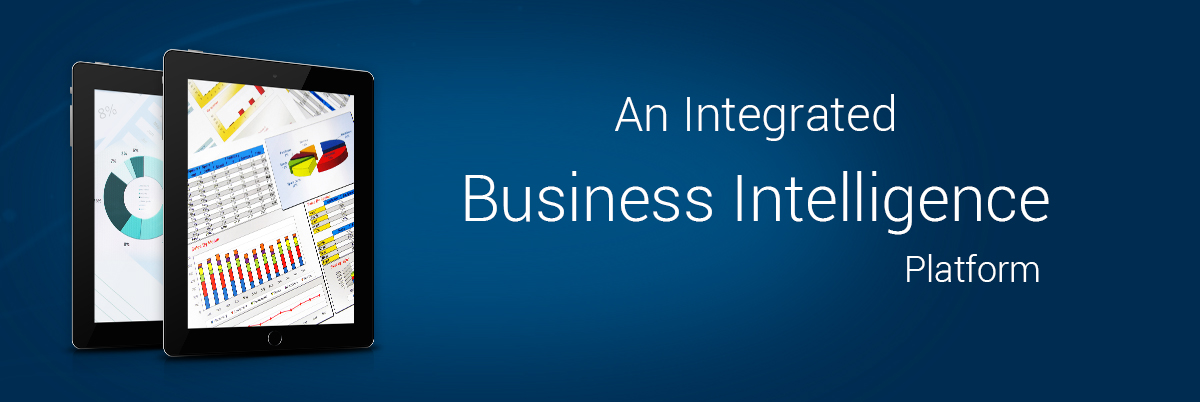
Pegasus is a proprietary business intelligence solution, one of the most advanced and useful BI reporting tools for medical practice management today. This system is an industry leading analytics tool with unmatched transparency relating to payment and operational performance. It is packed with easy-to-use dashboards, interactive reports and data displays.
Pegasus Knows What's Important to You
Because Pegasus was developed by Constellation Healthcare Technologies, a leading medical billing, collections and business management services company, it addresses what's foremost on your mind, including:
Web-based tool and report examples:
- Delivers In-depth Analysis of PM Software Data
- Dashboards
- Process Control
- Executive Summary
- Claim Tracking
- Base Practice Metrics
- Practice Trends
- Reimbursement Metrics
- Collections Performance
- Daily Billing Status
- Receivables Management
- Future Cash Flow Forecast
- Business Modeling
What Makes Pegasus Different - and Better
It's Comprehensive
There are dozens of reporting programs out there, but most access billing data only, which gives you a very narrow view of your practice dynamics. Pegasus consolidates data from multiple servers, multiple applications and even multiple locations to give you a complete view of your business in one place.
It's Fast
Pegasus was built with advanced business intelligence (BI) technology that transforms ordinary relational database tables into multidimensional data sets. Complex and data-intensive inquiries are returned in a matter of seconds. There is no need to wait for information you need right now.
It's Intuitive
Pegasus presents information using a set of rich visual displays. Analysis and decision-making become more natural and efficient processes as information is quickly rendered and graphically portrayed. Significant information such as indicators, relationships and trends are easy to spot and understand. Views and filters are available for interactive inquiry and analysis.
It's Accessible


